Optimizing Performance in Frame
Note: the most up-to-date version of this post is available on our new Knowledge Base. You can find it here.
Frame is a metaverse platform that runs from a web browser. This makes it super easy to get into, but it also means you need to be cautious about how many things you can bring into your Frame at once if you want to maintain smooth performance.
This post will give you some tips, tricks, and tools to help you optimize your Frame and identify areas where you can improve its performance. Ultimately, it's up to you to decide what you want to prioritize. Some people expect most of their users to be on desktop, so they might be okay with having lots of assets in their Frames and beefier 3D environments. Others prioritize accessibility from mobile devices, so for them it's important to limit the number of assets and ensure they are using a highly optimized 3D environment.
We try our best to let you have the best of both worlds. For example, we know iOS Safari struggles to render lots of high-resolution images and videos. Safari actually struggles to render lots of anything. So, we automatically downscale images and videos on iOS because of this. Even still, though, you will run into limitations on iOS Safari first before nearly any other platform. So, if iPhone is a key target for you, you'll need to be especially careful.
Let's dive in.
High Level Tips
- If you want your Frame to work on mobile, particularly on iOS Safari, you should limit the amount of assets in your Frame to the bare necessities.
- Rather than try to stuff everything into the same Frame, see if you can distribute your assets and your users across multiple Frames. Then, make it easy for people to move between those Frames using the Go To Menu or Frame Links.
- Be cautious about 3D models you find on Sketchfab or other online platforms - they often have not been optimized for real-time collaboration environments like Frame.
- Use Frame environments that are as big as you need them to be. If you're making a small meeting space, you probably don't need to use our massive Auditorium environment.
- Set videos to NOT autoplay.
- Use webcams/streaming screens only if you need to.
- Compress your images/spheres before importing them using tools like squoosh.app. You can adjust the intensity of the compression if you find it's affecting the clarity of your image.
- Don't use too many particle effects, particularly ones like "Smoke" which are very taxing on performance
- Make sure you clean up assets you aren't using or don't need anymore by deleting them from your Frame. You can check to see the assets in your Frame down at the bottom of your Frame settings
- If you have lots of users in your Frame, we have a toggle in the sidebar that lets you "prioritize performance". This will render simplified versions of the avatar to try to keep your performance decent. If you are okay with the lag and want to keep the better avatars, that's okay too!
- You may not want to have too many browser tabs or other applications open when you use Frame.
- Use Chrome or Edge when you can, but on iOS you have to use Safari. iOS Safari is the hardest device to achieve good performance on. It is our sincere hope that Apple either lets other browsers run on iOS (Chrome is just a skin of Safari), or that they invest in Safari so that it can actually compete with other web browsers.
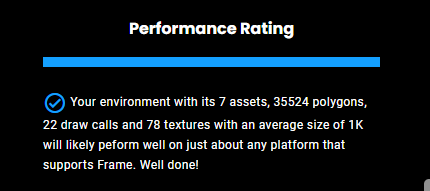
Performance Rating
There's a new basic Performance Rating in Frame that you can use to get some high-level info about what's in your Frame.

Next to Performance Rating, you'll see an FPS (frames-per-second) counter. Low FPS is a bad sign. Generally speaking, you want to shoot for 60 FPS. If you get below 40 FPS, you will probably start to notice some lag.
There are lots of things that can contribute to low FPS. Too many textures (images), videos, 3D models, etc. can all contribute to low FPS. We do a few checks to see if we can detect what might be causing your performance to be bad, and we'll give you a warning if we can detect an obvious performance problem. To calculate your performance rating, we check a few things:
- The poly count, which roughly counts the complexity of the 3D models in your current view. The higher the poly count, the more complex your geometry, and the lower the fps you might have. This is why optimizing your 3D models and 3D environments is so important.
- The texture count, which counts how many textures are in your Frame. These could be textures from images, videos, or the textures on 3D models. We also check the average resolution of your textures. Some devices (iOS Safari) struggle with high resolution textures. More textures or higher resolution textures can lead to worse performance.
- Draw call count, which roughly counts how many meshes are being rendered in your current camera perspective. The higher the draw call count, the worse your performance will be.
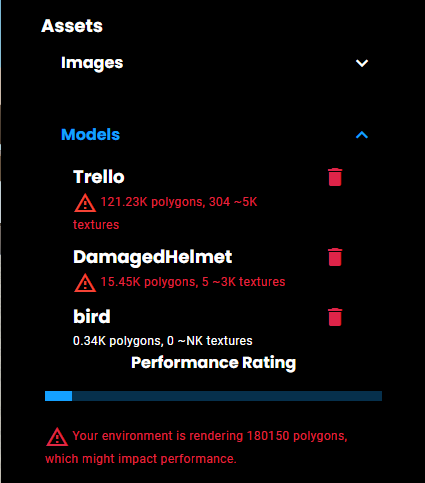
Perhaps one of your counts is really high and you aren't sure why. 3D models are often the culprit, because many models on Sketchfab or other services are not necessarily optimized for usage in a real-time collaboration platform like Frame. We let you see some basic stats about your models to help you figure out which ones might be causing performance problems. You'll find this in Frame Settings, right above the Performance Rating. Here I've popped up "models". Take a look:

These warnings let me know that these models might cause issues. As you can see, the overall Performance Rating for my Frame is quite low as well. On my desktop, the Frame still does fine. On mobile it lags.
It's important to point out, though, that this might not necessarily be a problem if you expect your guests to join from desktop computers. If your guests are on mobile, particularly iOS safari, this could be a problem, though. In extreme cases, it might prevent the Frame from loading altogether!
The Babylon Inspector
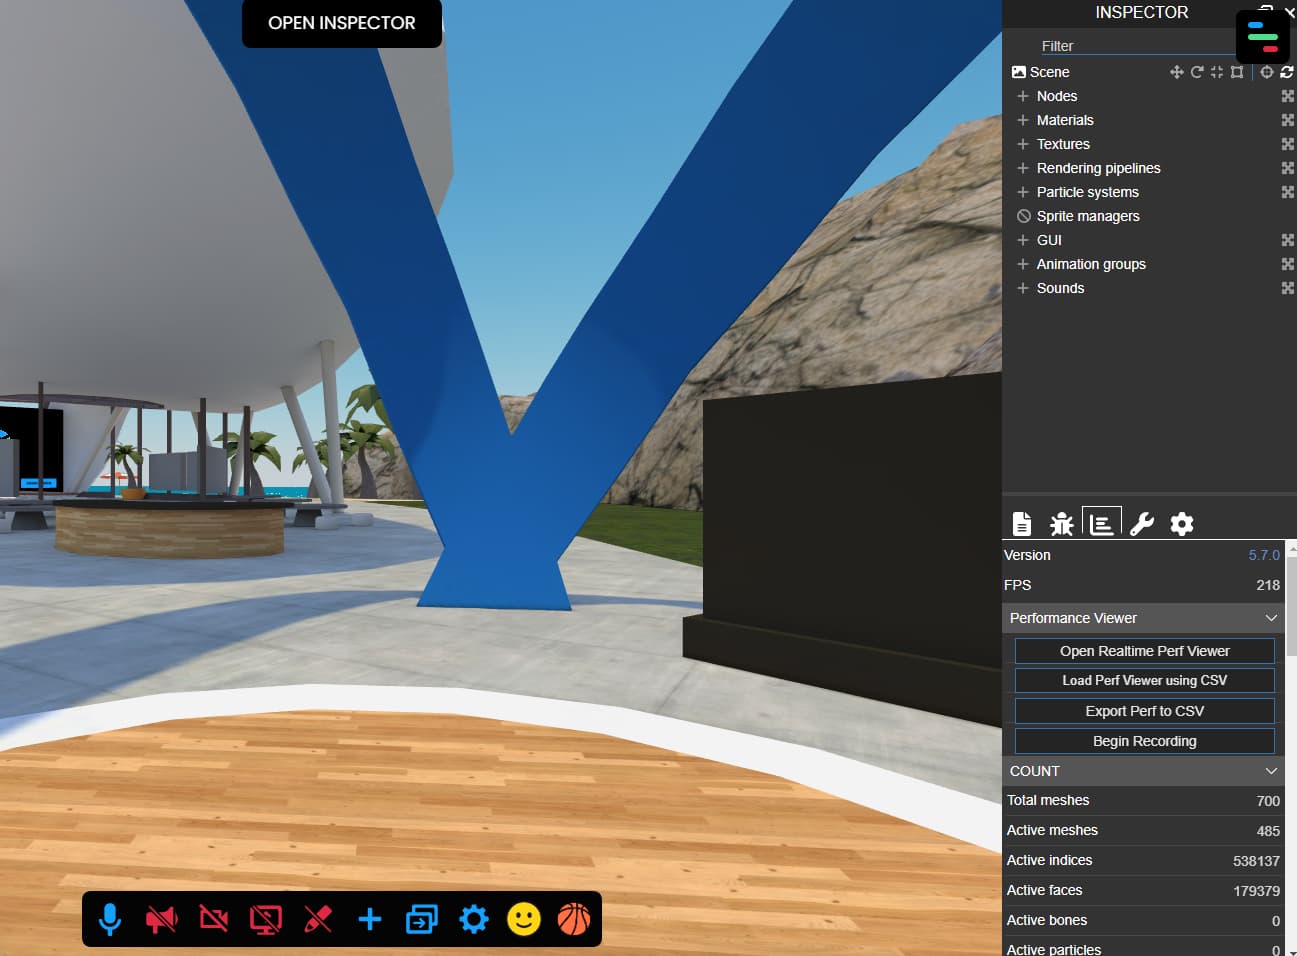
We build Frame with a front-end development framework called Babylon.js and we have a close relationship with the awesome Babylon.js team (read more about Frame and Babylon.js here). Because of this, we have access to some powerful tools from Babylon.js that you can use to dive even deeper into your performance issues. One of them is the Babylon Inspector. This tool is a lot more complex than our simple Performance Rating tool, so we don't make it generally accessible unless you know the secret key to unlock it. Well, I guess it's not a very well kept secret anymore (heh). Just put ?debug=true at the end of your Frame url, and then you will have a new button at the top center of your Frame that will let you open up the Babylon Inspector.
You will need to close the Frame sidebar to see the Babylon Inspector. Once you open the inspector, you'll see a row of horizontal icons about halfway down. Click the one in the middle that looks like a little graph and you will get a faster, more comprehensive look at some counts and stats that all play a role in how well your Frame performs.

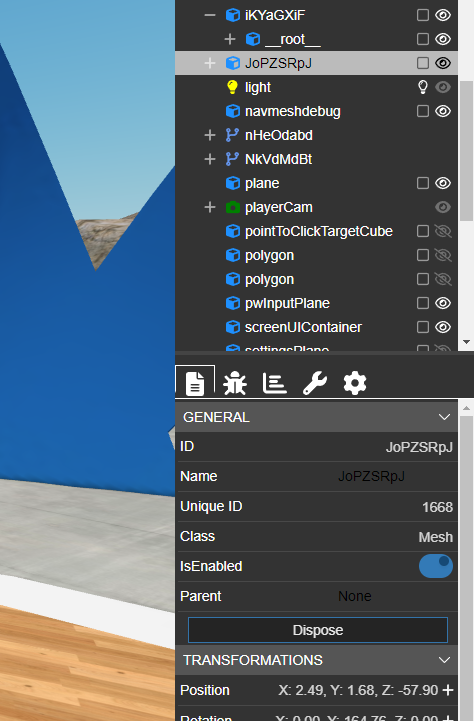
The FPS counter here updates in real time instead of once every three seconds, and there are a lot more details you can dive into. Those who have experience with 3D geometry or performance debugging will be familiar with many of these terms. You can also look into any single item in your Frame by popping open the "Nodes" section up at the top of the Inspector. This will include everything in the scene, including avatars, and you can click on each item and then see information about it by clicking the page icon that is the first one in the row of horizontal icons.
This tool is handy because you can click the eyeball icon next to an item to hide it, and you can even click the "dispose" button down below in the general menu to remove the item from the scene entirely. This does not permanently delete the asset from your Frame. It just gives you the opportunity to temporarily see how removing it might impact your performance/FPS. If you dispose of the item altogether instead of just hiding it, you will need to refresh the Frame to bring it back into the scene. If you just hide it with the eyeball icon on the right, you can bring it right back by clicking the eyeball again.

Of course you can experiment with anything you'd like to in the Babylon Inspector, and while it might "break" things temporarily in your Frame, just keep in mind that changes that you make from the Inspector are not permanent and you can always bring things back to the way they were simply by refreshing your Frame.
Generally speaking, we don't recommend having any more than:
- 200 draw calls
- 130,000 active faces
- 20 materials
---------------
Hopefully these tips give you some good starting points as you figure out how to make your metaverse beautiful while still maintaining decent performance. It's a balancing act, and you have to decide what you want to prioritize.
We're here to help if you are having performance issues in your Frames and the above tips and tools don't help you get to the bottom of it. Send us an email at hello@framevr.io with a link to your Frame and some screenshots of what you see in your Babylon Inspector and we'll do our best to help!
You might Also Like
.jpg)
Artificial Intelligence and the Metaverse: Introducing Luna
Artificial Intelligence in the Metaverse. Luna comes to Frame.
Read More
There Are Now Hundreds of Collaborative VR Tools - What's Next?
Some personal thoughts about the ever-more-crowded 3D collaboration space and how it's moving.
Read More
Bringing Complex 3D Models Into Frame
From pizza to Pompeii, you can bring some awesome 3D models into Frame.
Read More