Analytics
Learn to track usage, attendance, and engagement metrics
Depending on your Frame tier your Frame has analytics available to help you understand who is connecting to your frame and what actions they are performing while they are active.
Frame Settings
Free Frames do not include analytics history. To get analytics you must be on a paid Frame.
- •Basic Frames include 7 days of analytics history.
- •Plus Frames include 6 months of analytics history.
- •Pro Frames include unlimited analytics history.
More information on subscription tiers can be found in the Pricing tutorial.
Click the Graph in your Frame's sidebar to access Analytics. A graph activity feed will appear showing all of the selected event types.
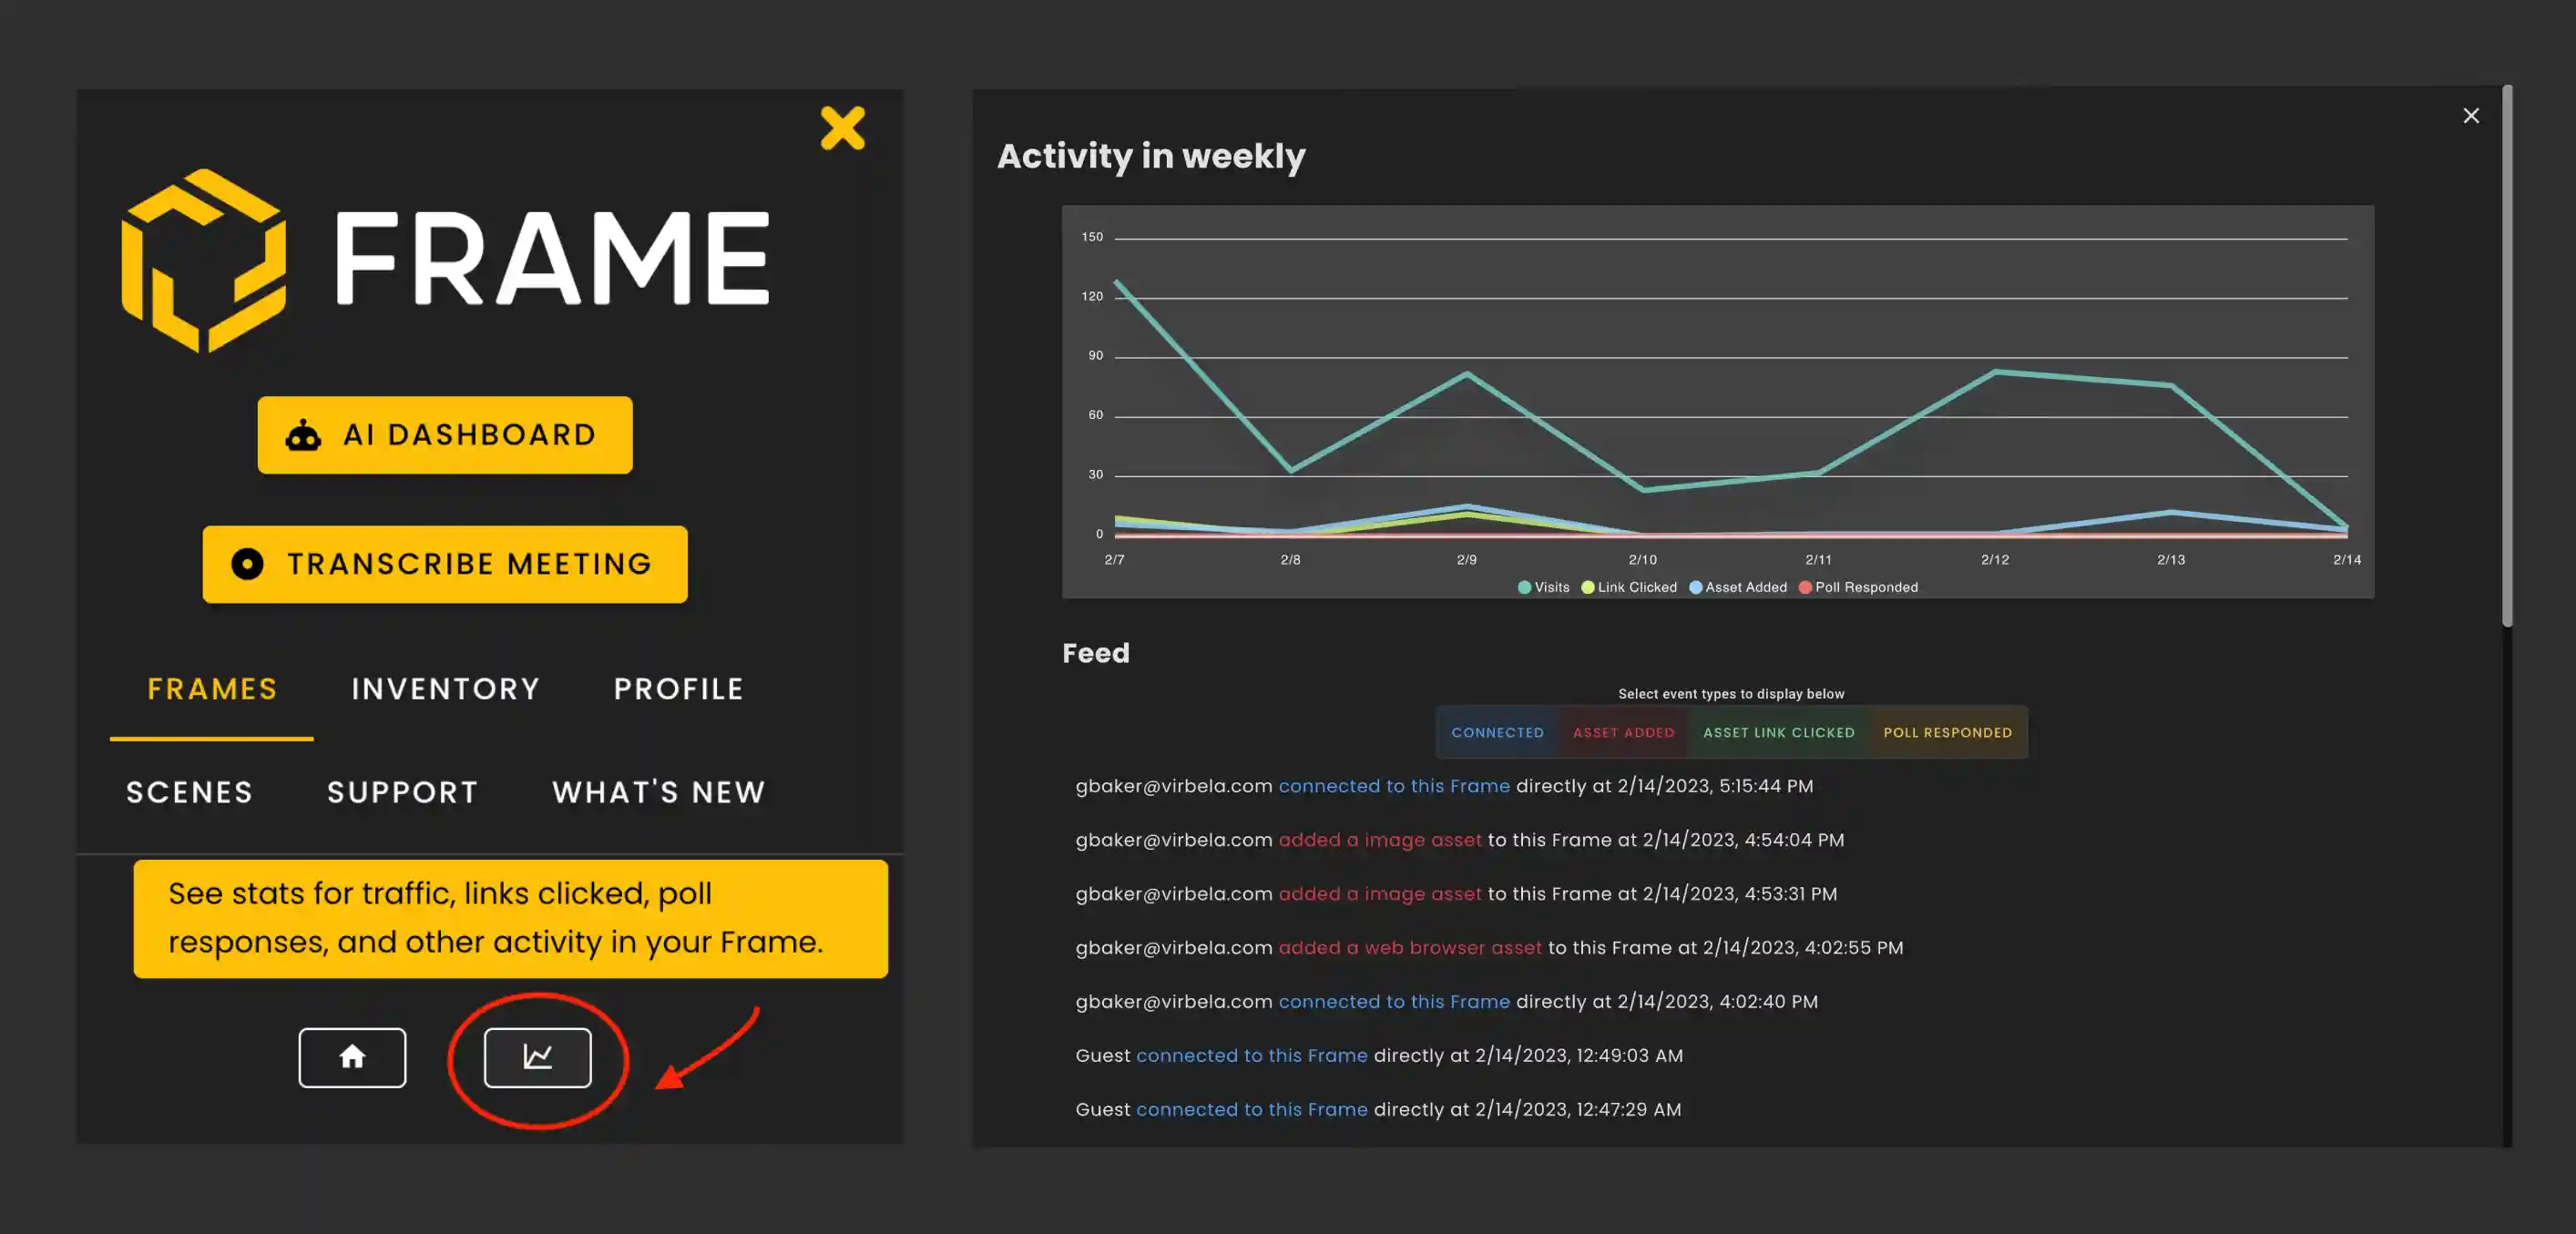
You can track event types by themselves or multiple at once by clicking a tag.
- •Connected
- •Asset Added
- •Asset Deleted
- •Asset Link Clicked
- •Poll Responded
- •Voice Zone Entered
- •Popular Zones
What Analytics Tracks
Analytics will show who is connecting to your frame and what actions they are performing while they are active.
- •For connections, you can see what website people came from to get to your Frame.
- •When assets were added or deleted from the frame.
- •Links clicked, you can see what assets people clicked on.
- •Poll responses, you get to see how people responded to various polls (but if those polls were anonymous, you won't be able to see who responded!).
- •Voice Zones entered shows how many times voice zones were entered.
- •Popular Zones will track which zones are most utilized.
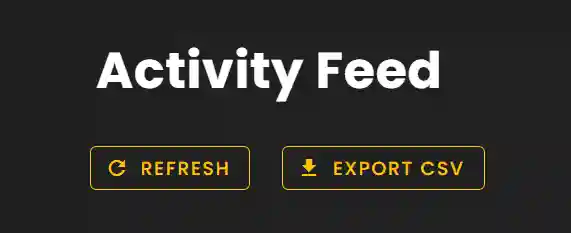
Activity Feed
Analytics can also be exported to CSV so you can view the results in a sheet format.
Ready to build with Frame?
Join thousands of creators who are building amazing 3D experiences with Frame VR.
For technical assistance, please contact us at support@framevr.io or reach out via our Discord community.
For general inquiries or feedback about Frame, please email hello@framevr.io